🎉 2025-Q4 Overview
🚧 WIP: Release Management
We are actively building our next-generation CI/CD pipeline to fully automate on-premise deployments and establish a strict single source of truth. This is a massive epic, and we've just completed the foundational milestone!
What we achieved this quarter:
- The
site-valuesRepository is Live: We have officially launched the new central repository. This will eventually become the single source of truth for the state of all our environments. - Helmfile Migration: Teams have begun migrating and building their
helmfile.yamlconfigurations within the new repository.
What’s Next? Currently, teams can still utilize their existing umbrellas in the helm-charts repo as we transition. In the upcoming quarters, we will be rolling out the fully automated 5-layer CI/CD loops (Dev -> QA -> Product -> Prod) and our native air-gapped packager.
���👉 See the grand vision: Check out the target architecture and see where we are heading in the Knowledge Base: Release Management (WIP).
📊 Monitoring & Observability
🎯 Prometheus: Scraping at the Service Level
We've updated our Prometheus configuration to support scraping metrics at the Service level, rather than just the Pod level!
Previously, scraping only at the pod level meant that metrics representing global states were duplicated for every replica you had running. Now, you can scrape a service endpoint once, giving you accurate, cluster-wide metrics without the noise.
Example Use Case:
Imagine you have an Nginx deployment alongside an exporter that tracks cluster-wide stats, such as the total data in a shared cache
or the global active connections across your environment. If you have 3 Nginx pod replicas and Prometheus scrapes the pods,
it records those global numbers 3 times—artificially inflating the numbers on your dashboards! By scraping the Service,
Prometheus queries the metric just once, giving you the true, deduplicated metrics.
🚀 CI/CD Improvements
🧹 Automatic Cleanup: 1-Week TTL for Jenkins Bundles
To prevent our storage from filling up with old artifacts, we've implemented a Time-To-Live (TTL) of one week for all bundles created by the Jenkins bundler pipeline.
This ensures our disks stay clean and performant without requiring manual cleanup, while still giving you plenty of time to use your freshly baked bundles!
✂️ Leaner Shared Workflows
Continuing our initiative from Q2 to make our CI/CD pipelines more modular, we've done some spring cleaning in the shared-workflows repository.
We've removed several custom actions that are already handled perfectly well by established open-source actions. The removed custom actions include:
login to azurebuild docker imagepush docker to azurebuild and push helm chart
By relying on standard open-source actions for these steps, our workflows are now faster, easier to maintain, and less prone to custom bugs.
🛡️ Authentication (OPAla)
🤫 Shushing the Noise: Filtered OPA Decision Logs
Tired of scrolling through endless "Allowed" requests to find the one that failed? We've updated the OPA decision logs so that only un-allowed (denied) requests are printed.
This drastically reduces unnecessary noise in the logs, allowing you to spot security blocks and authorization errors instantly.
In the future, we will combine this with our Loki to set up dashboards and alerts whenever an unexpected spike in denied requests occurs!
🐛 OPAla Auth-Bundler Fetching Fix
We resolved a tricky bug in the OPAla auth-bundler that caused failures when trying to fetch assets if not all environments were perfectly synced to the same version.
The Fix: The system is now much more resilient and will automatically fetch the latest available version of the assets for each environment independently.
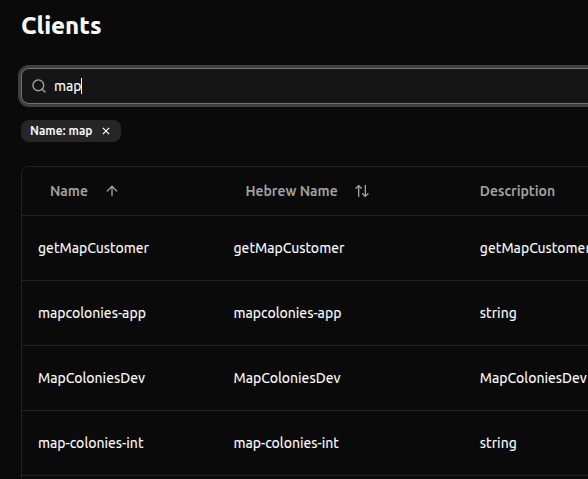
🔍 Find Clients Faster in Auth-UI
We've improved the UX in the Auth-UI! You can now search for clients directly by their Name instead of having to remember or search by their branch. Finding the exact client you need is now just a quick text search away.
📦 MC-Packages
📡 js-logger: Native gRPC Support
We’ve upgraded our js-logger NPM package to support sending logs directly via gRPC.
This is a massive performance boost, allowing your services to stream logs highly efficiently to our preferred observability collector, Grafana Alloy.
📏 express-access-log-middleware: Full OTEL Standardization
As part of our continuous drive to standardize our observability stack, the express-access-log-middleware NPM package has been upgraded.
All HTTP access logs generated by this middleware are now automatically formatted in the OpenTelemetry (OTEL) format. This ensures seamless integration with our logging pipeline and gives you beautifully parsed, queryable data in Loki right out of the box!
This quarter was all about stability, cleanup, and standardizing our observability! If you have any questions or need help implementing these new changes, feel free to reach out to the Infra team. 💻🚀