Vector
Vector Overview
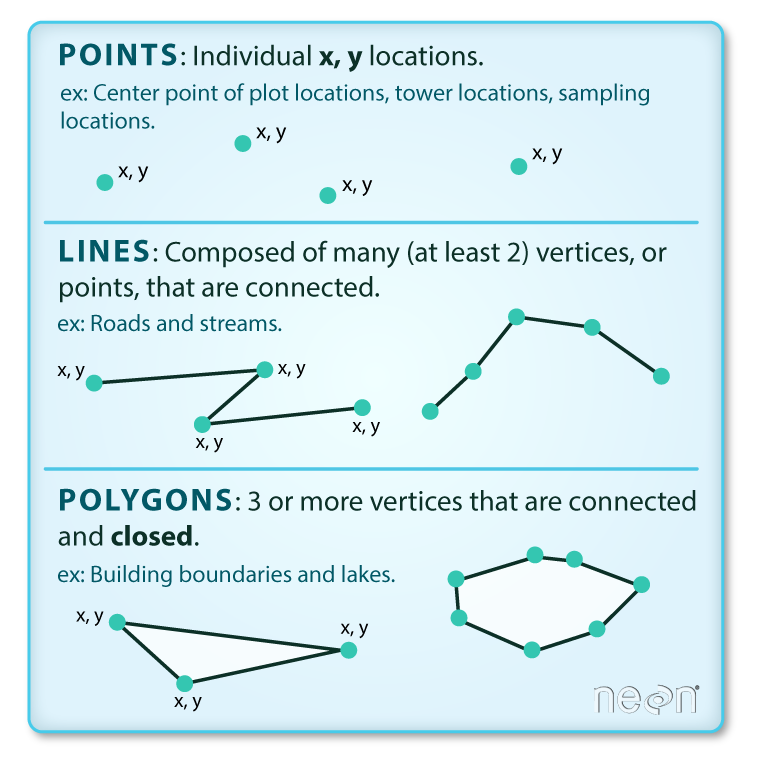
Vector data structures represent specific features on the Earth’s surface, and assign attributes to those features. Vectors are composed of discrete geometric locations (x, y values) known as vertices that define the shape of the spatial object. The organization of the vertices determines the type of vector that we are working with: point, line or polygon.
Types of vector objects
Points
Each point is defined by a single x, y coordinate. There can be many points in a vector point file. Examples of point data include: sampling locations, the location of individual trees, or the location of survey plots.
Lines
Lines are composed of many (at least 2) points that are connected. For instance, a road or a stream may be represented by a line. This line is composed of a series of segments, each “bend” in the road or stream represents a vertex that has defined (x, y) location.
Polygons
A polygon consists of 3 or more vertices that are connected and closed. The outlines of survey plot boundaries, lakes, oceans, and states or countries are often represented by polygons.
Pros and Cons
Vector data has some important advantages:
The geometry itself contains information about what the dataset creator thought was important The geometry structures hold information in themselves - why choose point over polygon, for instance? Each geometry feature can carry multiple attributes instead of just one, e.g. a database of cities can have attributes for name, country, population, etc Data storage can be very efficient compared to rasters The downsides of vector data include:
potential loss of detail compared to raster potential bias in datasets - what didn’t get recorded? Calculations involving multiple vector layers need to do math on the geometry as well as the attributes, so can be slow compared to raster math. Vector datasets are in use in many industries besides geospatial fields. For instance, computer graphics are largely vector-based, although the data structures in use tend to join points using arcs and complex curves rather than straight lines. Computer-aided design (CAD) is also vector- based. The difference is that geospatial datasets are accompanied by information tying their features to real-world locations.