Grafana
You can use Grafana at https://grafana.mapcolonies.net.
Grafana is a visualization tool that allows you to query, visualize, and analyze metrics from multiple data sources, such as Prometheus, as well as trace data from Tempo.

You can read more about Grafana in the Grafana documentation
Grafana enables you to create and customize powerful dashboards that give insights into system performance, resource usage, and alerting metrics.

In addition to visualizations, Grafana is also integrated with alerting capabilities, allowing you to trigger alerts when certain conditions are met in your metrics data.
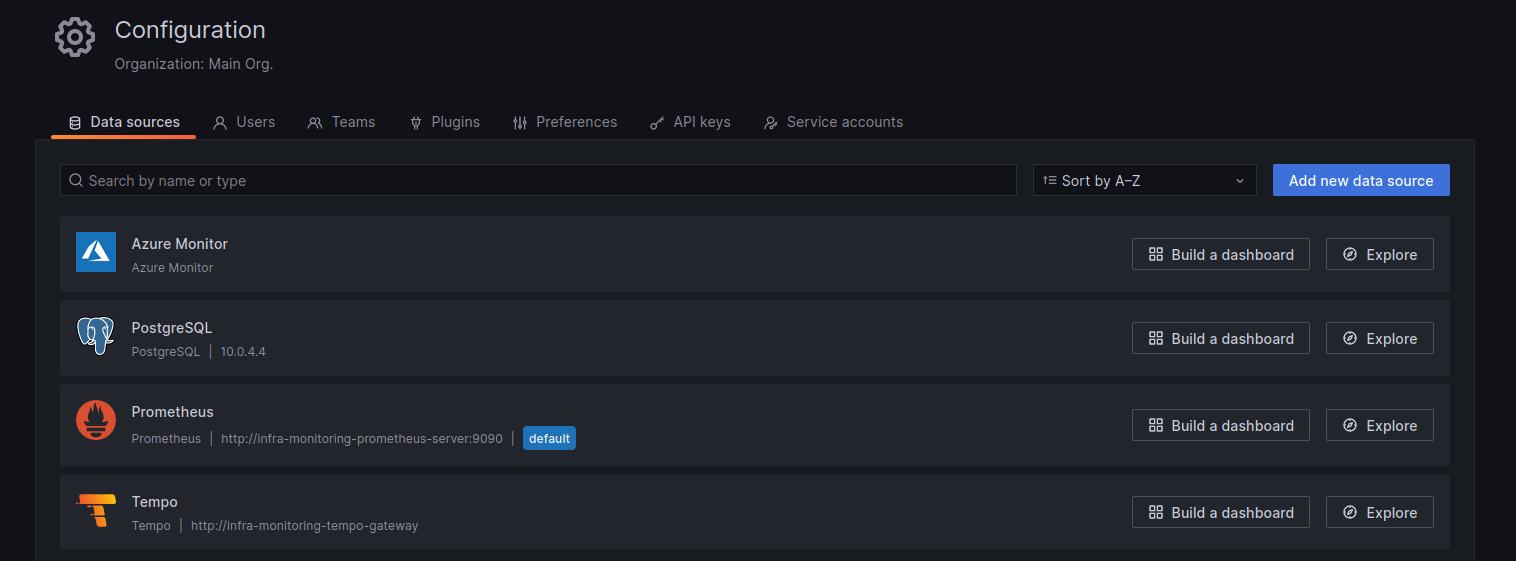
Multiple Data Sources
Grafana supports connecting to multiple data sources, allowing you to visualize and analyze data from various platforms like Prometheus, Elasticsearch, and Tempo in to a single dashboard.
For a full list of supported data sources, check out the Grafana documentation on data sources.