📈 Prometheus
You can access Libot's Prometheus at https://prometheus.mapcolonies.net.
Prometheus is the beating heart of our observability stack! It is an open-source monitoring system designed to aggressively collect and store metrics as pure time-series data. ⏱️
🎯 Service-Level Scraping Architecture
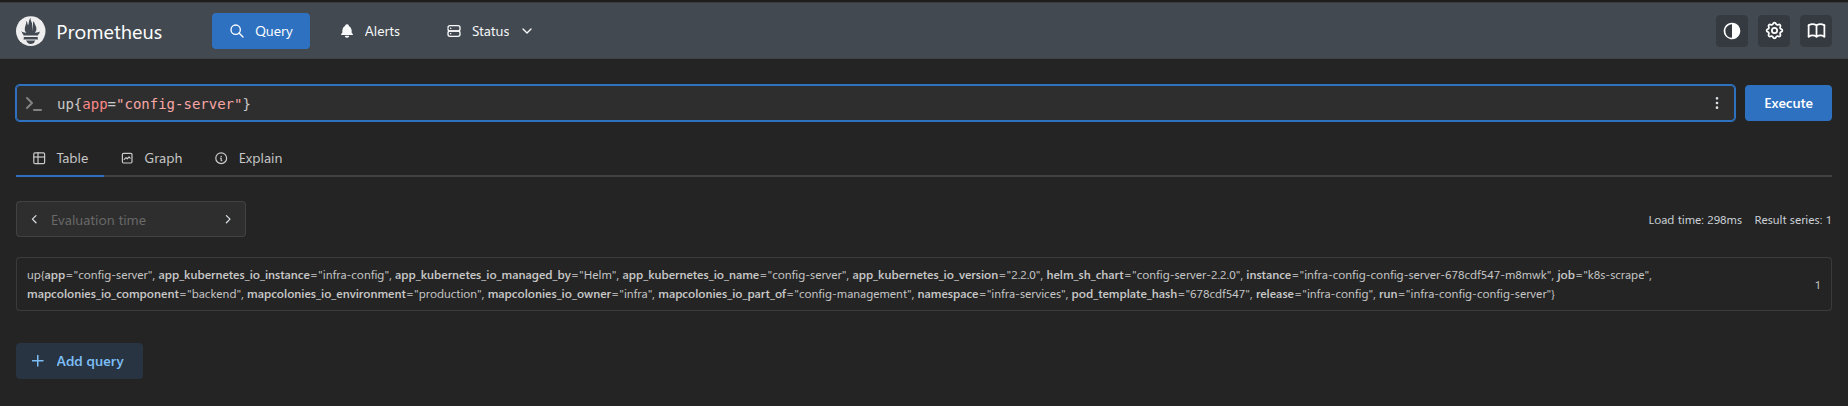
To guarantee accuracy and slash unnecessary load, our Prometheus is strictly configured to scrape metrics at the Service level—not just the Pod level!
Why? If we scraped at the pod level, global cluster states (like a shared cache or active DB connections) would be duplicated for every single replica you spun up. By scraping the Service endpoint instead, Prometheus grabs the metric exactly once! This gives us perfectly accurate, deduplicated cluster-wide metrics without artificially inflating the numbers. 🎯
🚨 The Alerting Engine
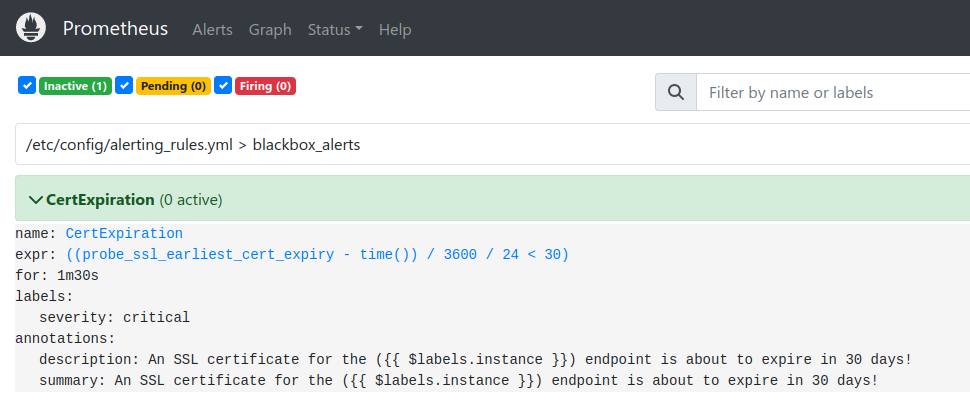
Prometheus never sleeps. It constantly evaluates predefined alert rules against the incoming metric streams. When bad things happen (CPU spikes, certificates expiring, endpoints crashing), Prometheus instantly fires alerts and ships them off to Alertmanager for routing!
🔌 Exporters
Prometheus doesn't just scrape your apps; it also scrapes a massive array of specialized exporters! Curious about how we monitor databases, clusters, or external endpoints? Dive into our dedicated Exporters Directory! 🚀