🔭 Monitoring Stack Overview
Welcome to the monitoring stack! This robust, Kubernetes-native setup gives us absolute, X-ray visibility into our cluster's health, infrastructure performance, and application behavior. 📊
We leverage a powerful suite of open-source tools to handle metrics, logs, and traces seamlessly—delivering a unified observability experience!
🏗️ Architecture Overview
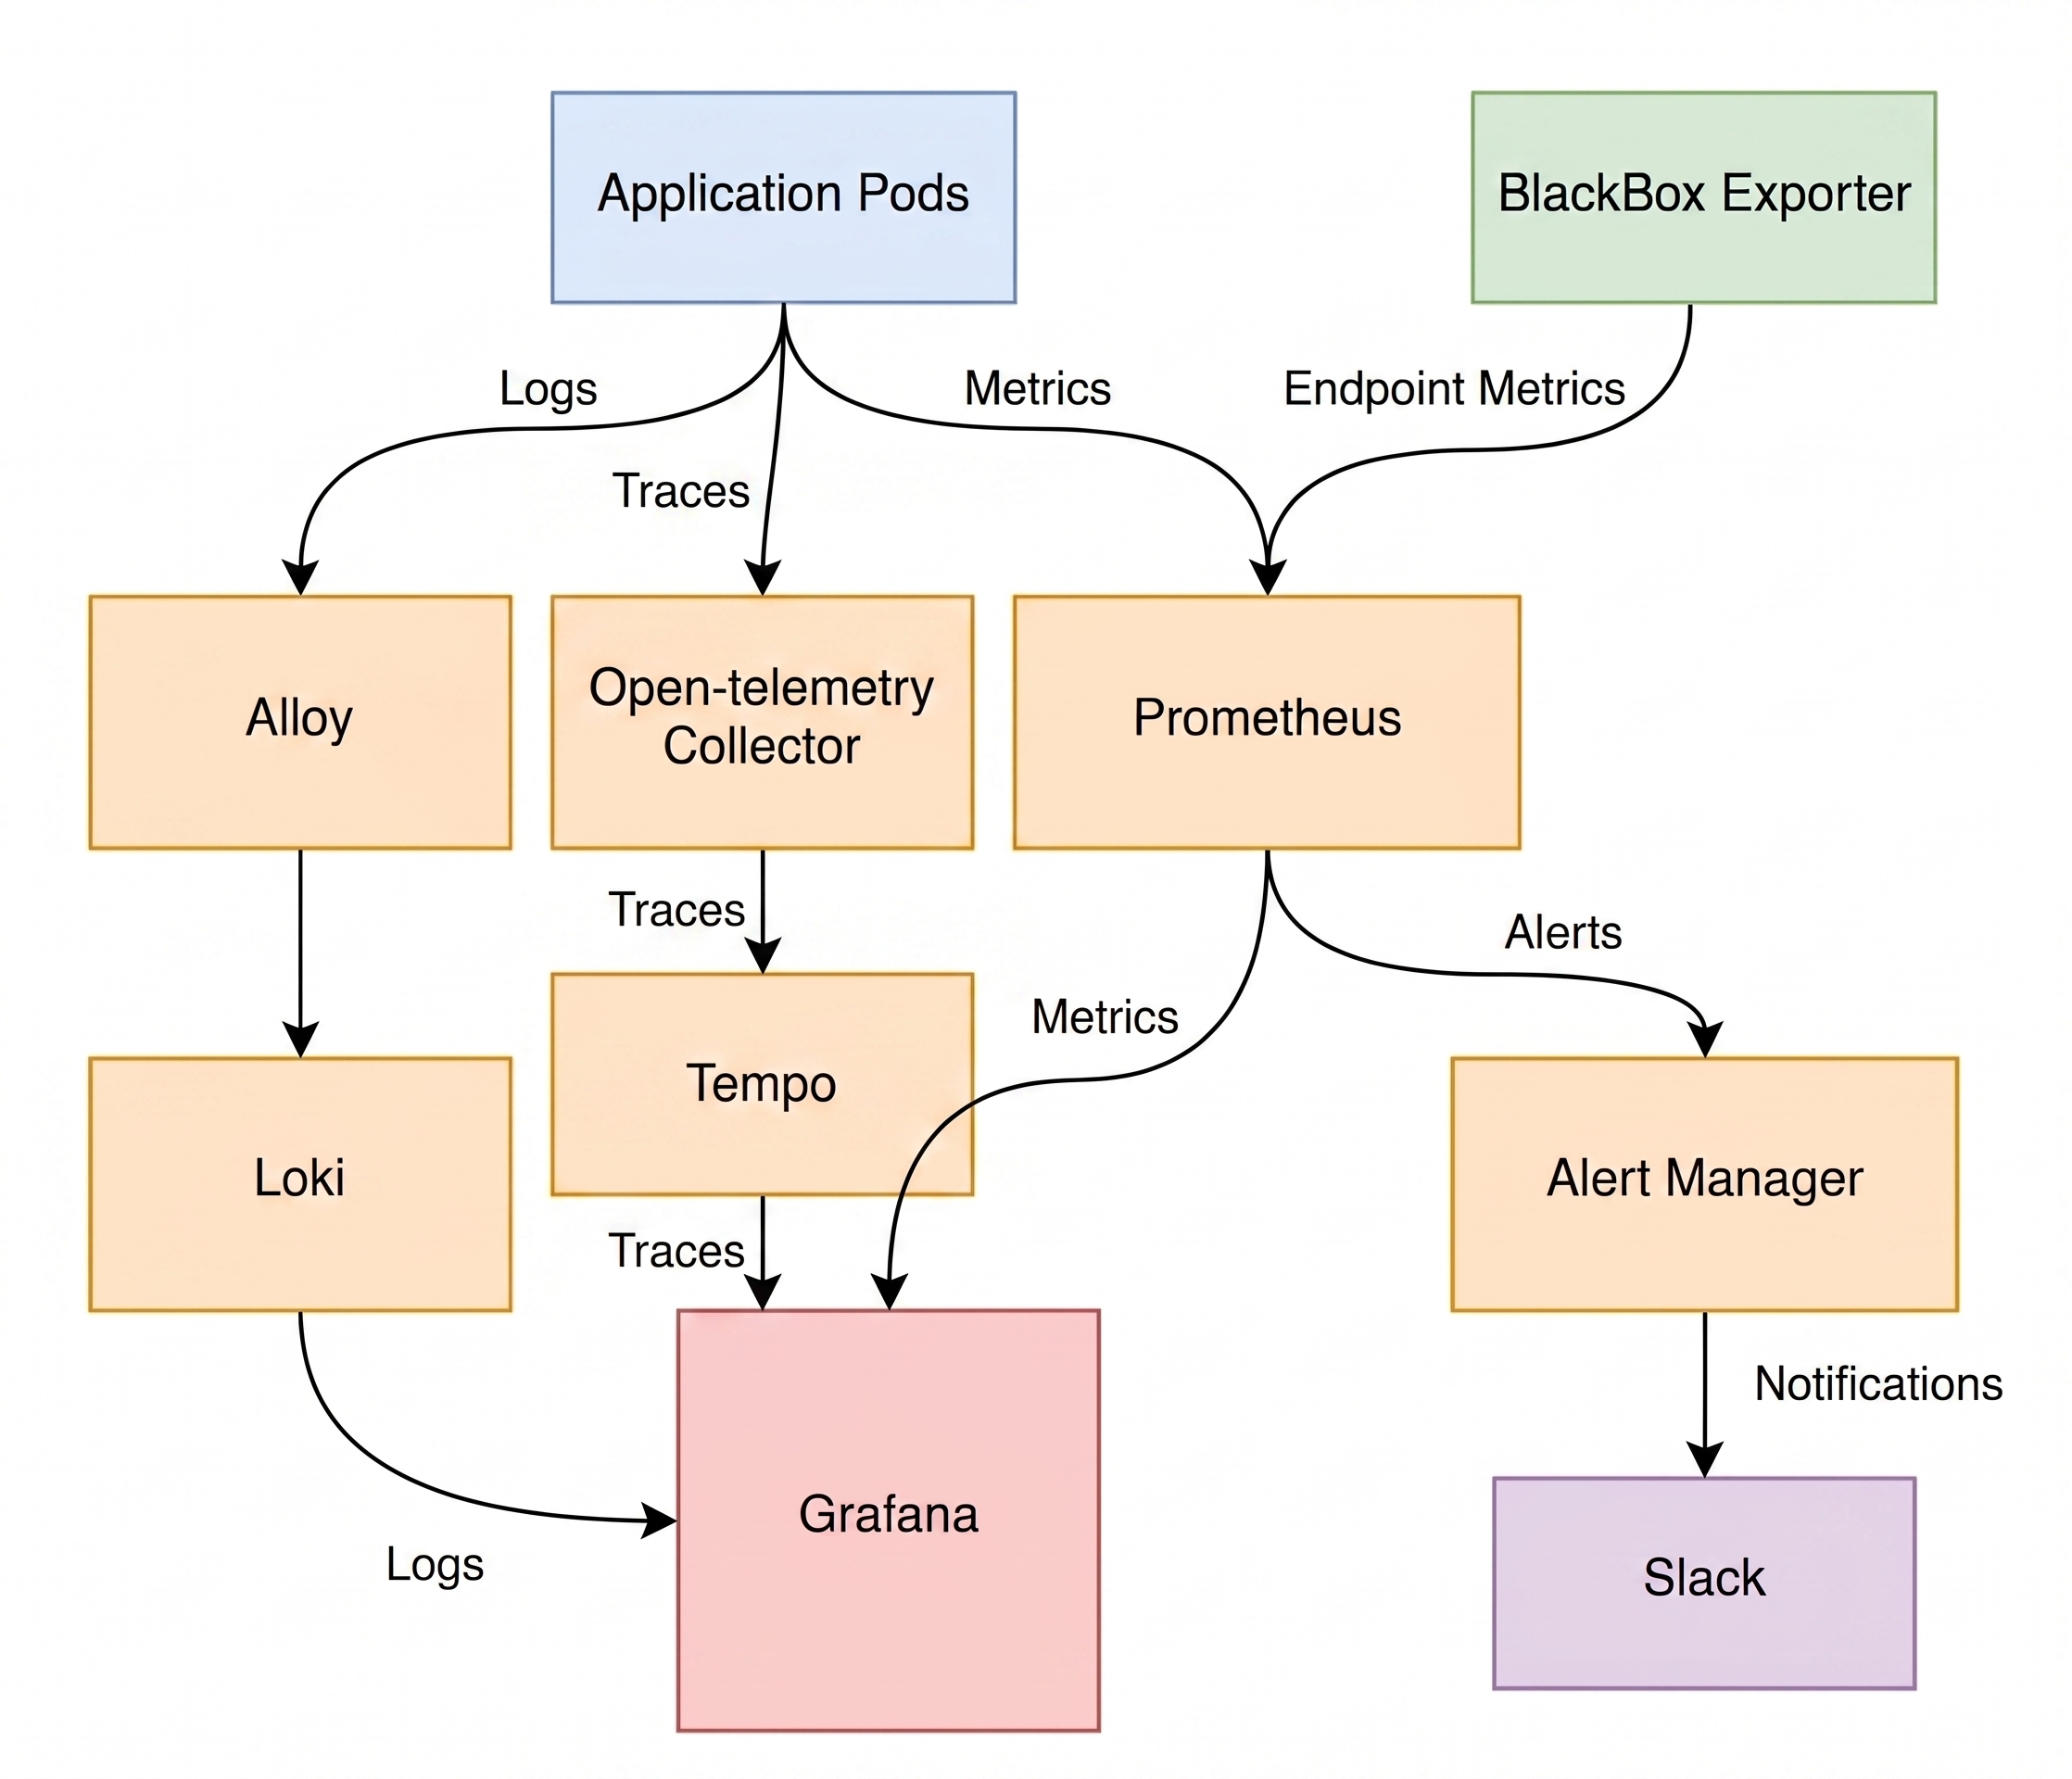
Here is a high-level look at how telemetry data flows through our ecosystem:
- 📈 Metrics: Your Pods and specialized Exporters expose metrics. Prometheus aggressively scrapes this data, feeds it to Grafana for beautiful visualization, and triggers crucial alerts via Alertmanager.
- 🕸️ Traces: Applications blast traces to the OpenTelemetry Collector (
infra-otel). It smartly routes and forwards them to Tempo (safely backed by S3) for deep querying in Grafana. - 🪵 Logs: Application logs are snatched by Grafana Alloy (either via pod labels or direct network push) and shipped to Loki (backed by S3) for lightning-fast searching.
🌟 General Guidelines & Killer Features
- 🤖 AI-Powered Dashboards (Grace Period): We have wired an LLM into Grafana! You can command the AI to auto-generate and modify dashboards for you.
⚠️ Important: During this grace period, the AI is strictly sandboxed. It can only create and modify dashboards inside theAIfolder. Keep our core dashboards safe! - 🔀 Alert Routing: Alertmanager pushes notifications to Slack, classified chats, and email based on global configs managed by the infra team. Need a new route? Just ask! (Note: We are migrating to native Grafana Alerts soon!)
📚 Service Documentation
Dive deeper into any piece of the stack using these guides:
- 📊 Grafana
- 📈 Prometheus
- ⏱️ Tempo
- 🔍 Loki
- 📡 OpenTelemetry Collector
- 🪵 Grafana Alloy
- 🚨 Alertmanager
🔌 Exporters
Want to know exactly how we gather metrics from databases or the Kubernetes API? Check out the Exporters Directory! 🚀