Kube State Metrics
Kube State Metrics (KSM) is your direct line to the Kubernetes API server! 🎧
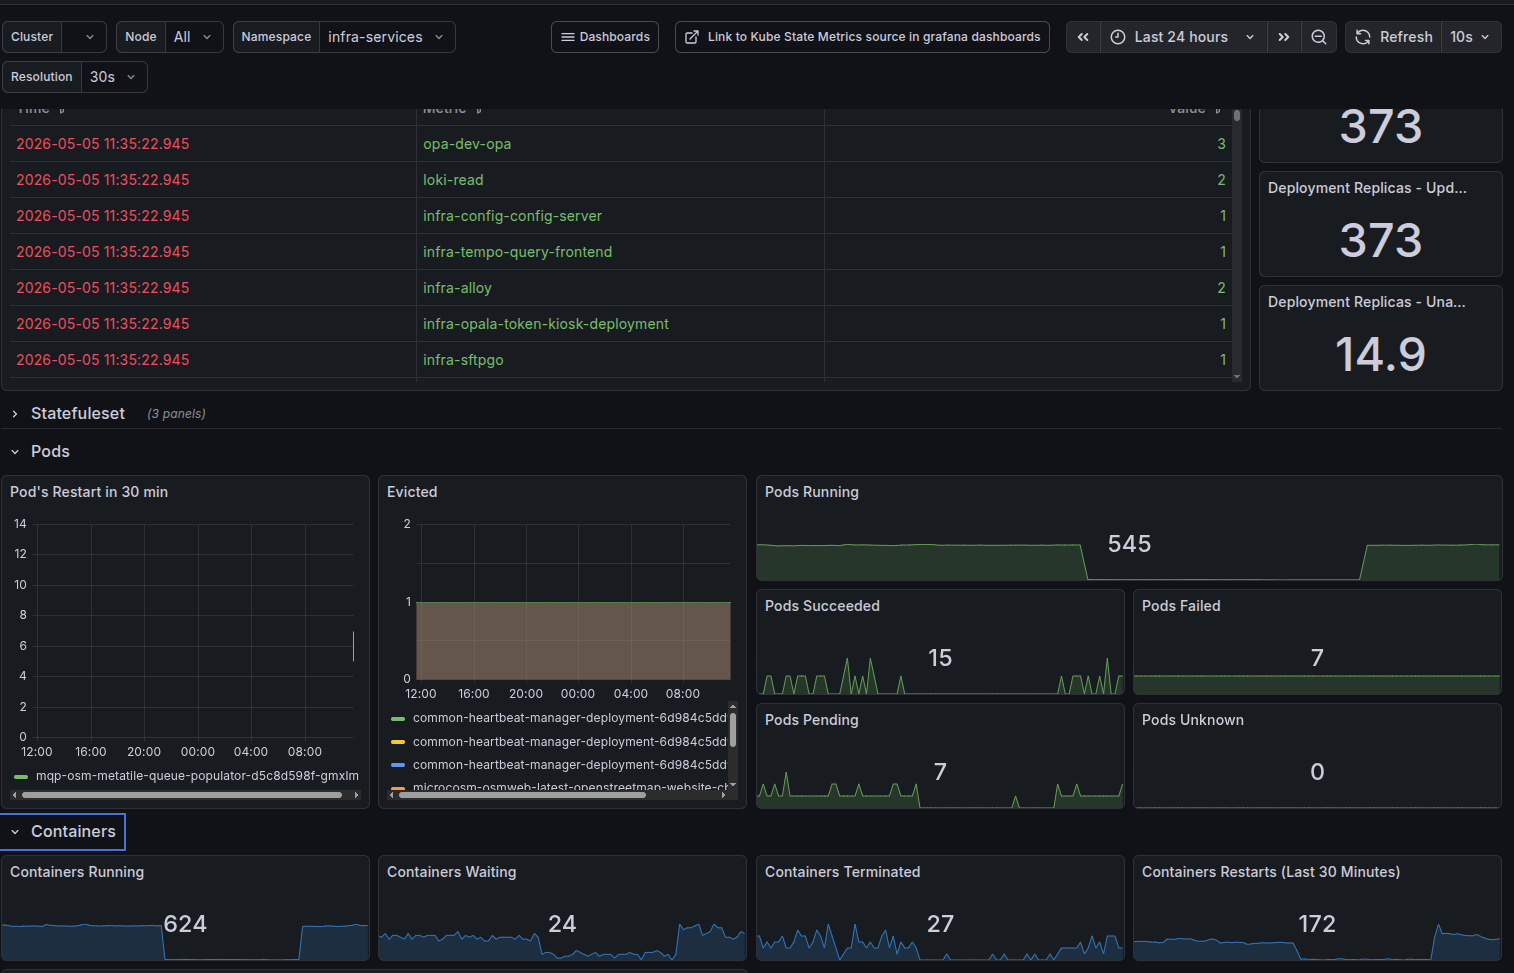
While the Blackbox Exporter probes our applications from the outside, KSM tells us exactly what is happening under the hood with our Deployments, Pods, Nodes, and other standard Kubernetes resources.
(Note for image update: Please add an image here showing a Grafana dashboard visualizing KSM data, like pod status or resource allocations).
🔍 What It Monitors
Out of the box, KSM tracks all standard Kubernetes resources globally.
Good news for developers: Zero configuration is required on your end! 🎉 You do not need to add special annotations, tweak your deployments, or deploy sidecars. KSM sees your standard resources automatically.
(Note: We do not currently use KSM to expose metrics for Custom Resource Definitions (CRDs).)
💡 Common Use Cases
KSM is incredibly useful for troubleshooting and optimizing your applications. Here are the top ways developers leverage KSM data in Grafana:
- 💥 Tracking Crash Loops: Build dashboards or set proactive alerts to detect when your Pods enter a
CrashLoopBackOffstate. This helps you catch startup failures or recurring application crashes immediately. - ⚖️ Resource Allocation vs. Actual Usage: KSM exposes the CPU and memory limits/requests configured for your Pods. By comparing these allocations against your actual usage metrics, you can easily spot if your services are over-provisioned (wasting money/resources) or under-provisioned (risking performance bottlenecks).